|
|
| 4. STRATEGIES FOR THE OJOS NEGROS VALLEY |
|
Sand mining in Southern California has undergone substantial changes in the past few years. Environmental regulations have discouraged operators from continuing to mine U.S. streambeds. Increasingly, sand-mining operators are finding it more cost effective to import the sand from south of the border. For example, out of eleven operators in the San Luis Rey river, in San Diego County, about 10 years ago, only two remain in business at the present time. In Los Angeles County, the annual consumption of aggregate sand is about 9 million tons; in San Diego County it is about 3.5 million tons. In the past few years, the cost of construction-grade sand in Southern California has increased from $6.50 to $12.00 per ton ($4.64 to $8.57 per m3). This increase is directly linked to the prevailing regulatory environment, which effectively discourages the mining of sand from local streambeds. The high cost of sand and the relative proximity of the Mexican streambeds makes it economically feasible to import sand from south of the border. In the past 6 years, the percentage of sand used in San Diego County and originating in Baja California has increased steadily, from close to zero to nearly 40% at present.
The U.S. Army Corps of Engineers requires a 404 permit (Clean Water Act: Discharge of dredged or fill material into navigable waters) in order to operate a riverine sand-borrow pit. The U.S. Fish and Wildlife Service and the California Department of Fish and Game require operators to obtain "take" permits to remove habitat or endangered species. This requirement limits the ability of operators to continue mining streambeds in Southern California. Thus, this sets the pattern for sand mining elsewhere, particularly Baja California, which is close enough, and where current regulations are not as stringent as in California. El Barbon Wash (Ponce, et al.1999) is the main streambed in the vicinity of the Ojos Negros valley (Fig. 7). Sand is currently being mined in El Barbon Wash (Fig. 8) by authorized operators. The current pit has aproximate dimensions of 1800 m length by 200 m width and 2.3 m depth, which amounts to 828,000 cubic meters, or 1.2 million tons, in the past two years. The extracted material is construction-grade sand. It is transported by trucks to Ensenada, where it is shipped in barges to destinations in Southern California. The sand is being used mostly as an aggregate for cement and asphaltic concrete. |
|
|
4.1 Environmental impacts The environmental impacts of sand mining in the Ojos Negros valley and environs can be summarized as follows:
Extractable volumes should be limited to those that can be replenished with normal hydraulic transport from the upstream basin. In addition, extraction should concentrate on deposition reaches, if any. There is a possibility for upstream headcutting and downstream degradation, which can lead to bank failure and stream widening. In El Barbon Wash, the downstream degradation will depend on the extent to which the canyon downstream of Real del Castillo Viejo (Fig. 9) is acting as a control on the upstream riverbed. No impacts are expected to stream fauna, which is negligible. The impacts to stream flora will depend on the extent to which riparian areas are affected by the mining operations. The flora observed in El Barbon Wash and vicinity include the following: Baccharis sarathroides (Hierba del pasmo), Baccharis glutinosa (Guatamote o batamote), Chilopsis linearis (Mimbre), Chrysanthemun leucanthemum, Clematis lasianatha (Barbas de chivo), Clematis pauciflora, Dasylirion wheeleri, Ferocactus acanthodes, Haplopappus sonorensis (Romerillo amargo), Heteromeles arbutifolia (Toyon), Lathyrus laetiflorus, Linanthus sp., Lonicera subspicata, Pluchea sericea (Cachanilla), Rhus ovata (Lentisco), Rhus diversiloba, Ribes malvastrum, Ribes viburnifolium, Salvia columbariae (Salvia), Salvia pachyphylla (Salvia rosa), Salvia vaseyi, Tamarix pentandra (Pino salado), and Yucca whipplei. There are no bridges in the vicinity of El Barbon Wash. Therefore, impact to structures will be limited to the existing concrete ford. Excavation may lead to channel degradation, which may negatively affect concrete ford stability. Impacts to local groundwater resources will depend on whether the excavation reaches the water table. The depth to the water table at El Barbon Wash has not been measured; in addition, it is subject to seasonal and annual fluctuation. The mining excavation should be restricted to depths well above the water table; otherwise, there is a risk of water loss by evaporation and surface runoff, which may negatively impact local water resources. Impacts to local landscaping and riparian habitat will depend on the extent to which the mining operation changes the natural landscape to fulfill its objectives. Impacts to surface water quality are expected to be negligible as long as mining is accomplished on dry washes. Impacts to groundwater quality will depend on the extent to which the mining operation results in spills of gasoline, oil, and other chemicals, which may eventually reach the water table. Increased noise and dust will depend directly on the volume of mining. Permissible noise levels are summarized in Table 4.
|
|
4.2 Socio-economic impacts The socio-economic impacts of sand mining in the Ojos Negros valley and environs can be summarized as follows:
The current mining encompasses areas of streambeds and compromises adjacent riparian areas. These areas have not been declared as "national property," "federal zones," or have been properly delimited. Therefore, they remain as part of the individual parcels of the ejidos and private properties. Access to the mining areas is through ejido land, and this leads to potential conflicts with local proprietors. The unprecedented export of large volumes of construction-grade sand to the United States has affected the local economy in many ways. Since export began more than 2 years ago, the cost of sand in Ensenada has increased markedly, from $40 mexican pesos per cubic meter prior to the export, to the current cost of $100 mexican pesos. This has increased the cost of construction and has led to higher housing costs. The export of sand has led to a scarcity of this construction material in the local and regional markets. In addition, the sand locally available is of poor quality; this has affected a host of industries that depended on this sand, particularly those that manufacture concrete-based products. The export of sand in large quantities jeopardizes the regional economy, since the extracted material is not readily replenishable. Therefore, current mining operations may lead to regional scarcity of sand within the 50-yr planning horizon (See Section 4.4). Current laws and regulations do not consider the export of large quantities of sand from natural streambeds. Therefore, there is a legislative and regulatory void on this issue. A large portion of the profits from sand mining operations are exported outside of the region; little of it remains to underpin the local economy. The frequency and weight of the trucks (30-40 ton weight) has negatively impacted the local transportation infrastructure (roads and bridges). The additional dust and noise caused by the trucks has negatively impacted the local population. Sand falling from the trucks during transport has affected vehicles and occupants traveling immediately behind them.
|
|
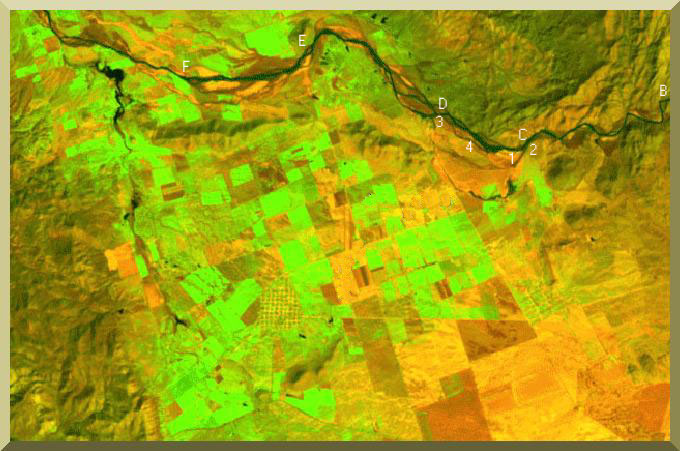
4.3 Current sand mining El Barbon Wash is currently being sand mined, and the sand is exported outside of the valley to destinations in Southern California. A hydrologic and hydraulic study was undertaken to assess the extent, impact and sustainability of the sand-mining operations. The bed profile of El Barbon Wash, shown in Fig. 10, was obtained from existing topographic maps. El Barbon Wash has a steep slope, averaging 0.03 from point A to B, i.e., as it comes down from the Sierra Juarez (point A) to reach the entrance to the valley (at point B). Within the valley, the bed profile of El Barbon Wash has a slope averaging 0.00535, measured from point B to H, the latter located at the downstream point within the Ensenada sheet, close to the valley exit. Figure 11 features an image of El Barbon Wash and the Ojos Negros valley, showing the locations of points B to F (A is east of B; G and H are west of F). |

|
| Fig. 11 Ojos Negros Valley and El Barbon Wash, showing sand-mining and soil-sampling locations. |
|
A field inspection undertaken on February 2002 showed that point C
is the most upstream location of current sand-mining operations, and
D is the most downstream location, for a total length of 1800 m of mined pit, measured along the streambed.
The width of excavation was estimated to be about 250 m.
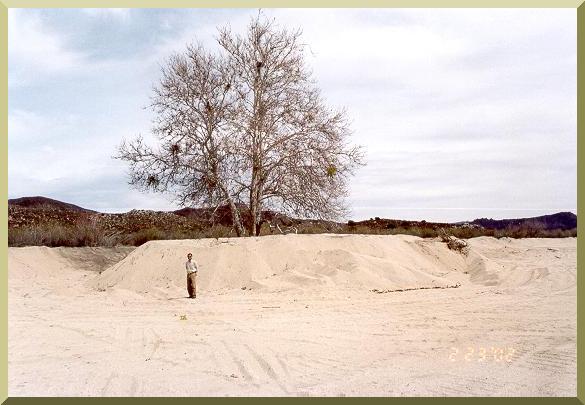
The average depth of excavation was estimated at 2.3 m (Fig. 12). The total amount extracted to date is estimated
to be about 1.04 million cubic meters.
Current sand mining operations have a permit to mine an area of 2,530,217 m2 in the streambed, amounting to a length of 10 km and a width of 253 m. With an estimated final depth of 3 m, the total volume of extraction is 7,590,651 m3. Between points C and D, six samples for grain-size analysis were collected at four representative locations, shown in Fig. 11. Summary results of the grain-size analysis are shown in Table 1. Sample grain-size distributions are shown in Fig. 13.
|

|
| Fig. 12 Sand mining in El Barbon Wash, showing 2.3 m-depth of excavation (23 February 2002). |
|
Table 1. Summary of grain-size analysis, El Barbon Wash streambed samples. | |||
| Sample number/location | D50 (mm) | D60 (mm) | D90 (mm) |
| 1 | 1.070 | 1.311 | 3.384 |
| 2 | 1.033 | 1.321 | 3.728 |
| 3A (top) | 0.800 | 1.000 | 2.322 |
| 3B (middle) | 1.205 | 1.475 | 3.526 |
| 3C (bottom) | 0.870 | 1.110 | 2.656 |
| 3 Average | 0.958 | 1.195 | 2.835 |
| 4 | 0.938 | 1.136 | 2.610 |
| Average | 0.986 | 1.226 | 3.038 |
|
4.4 Sand-transport modeling
Sand originating in upland catchments of the Sierra Juarez is delivered to El Barbon Wash at point B (Fig. 11). Downstream of this location, the stream slope decreases abruptly, to 0.00535. This change in slope makes possible the deposition of a fraction of the sediments that are brought from the upland catchments. The quantity that is deposited depends on the hydrologic, hydraulic, and sedimentological properties of the catchment-stream-flood plain system. Estimates of sand deposition in El Barbon Wash, downstream of point B (Fig. 11), were accomplished using the hydraulic model MODELRIVER. This model was developed at San Diego State University following the U.S. Army Corps of Engineers' HEC-6 standard. To determine the flood discharges at point B (Fig. 11), 4-hr storm depths for frequencies of 2 to 50 yr were obtained from the "Isohyetas de Intensidad-Duración-Frecuencia, Republica Mexicana" (1990) (see Table 2, Column 2). The conversion to 24-hr storm depths was accomplished by assuming the 4-hr storm to be encompassed within the SCS 24-hr Type I storm. Other required hydrologic data (catchment area, hydraulic length, channel slope, and curve numbers) was obtained from Ponce et al. (1999). The flood hydrographs were calculated using the U.S. Army Corps of Engineers HEC-HMS. The peak discharges are shown in Table 2 and the corresponding flood hydrographs are shown in Fig. 14. |
| Table 2. Flood hydrology characteristics of El Barbon Wash | |||
| Return Period (yr) | 4-hr Storm depth (cm) |
24-hr Storm depth (cm) |
Peak discharge (m3/s) |
| 2 | 2.8 | 5.7 | 328 |
| 5 | 3.6 | 7.3 | 614 |
| 10 | 4.0 | 8.2 | 801 |
| 25 | 4.3 | 8.8 | 935 |
| 50 | 4.6 | 9.4 | 1068 |
|
From point B to point F (Fig. 11), a study reach of 13,500 m was chosen for modeling purposes. This reach encompasses the
current sand-mining operations,
from point C to D, a length of 1800 m. The modeling was performed with cross sections every 100 m, for a total of 136 cross sections.
Based on digital terrain modeling (DTM), the average channel width in the study reach was determined to be 240 m.
Trapezoidal cross sections of 240-m bottom width and 2:1 side slopes were specified. At the
upstream end of the study reach, a sediment-rating curve was developed using the
Colby method
(see Fig 15).
MODELRIVER was run for a hypothetical 50-yr flood series, assumming a suitable sequence of 2-, 5-, 10-, 25- and 50-yr floods. The results of the sediment routing computations are shown in Table 3. |
| Table 3. Estimated sand deposition in
El Barbon Wash, from point B to point F (Fig. 7). | |
| Time horizon (yr) | Sand volume (m3) |
| 2 | 34,000 |
| 5 | 180,000 |
| 10 | 363,000 |
| 25 | 913,000 |
| 50 | 1,830,000 |
|
The results shown in Table 3 are an approximation, because the actual flood series is not known a priori.
Furthermore, the model does not account for the hysteresis in the sediment rating curve, the effect of which would be
to increase the amount of sand deposition
if the receding limb were to be longer than expected. This is certainly a possibility in El Barbon Wash, where recession times of flood
hydrographs have been
documented by eyewitness accounts to last days and even weeks. In view of the uncertainties inherent to sediment routing computations,
it is judged appropriate to multiply the amount shown in Table 3 by a safety factor equal to 3.
This would place the sand deposition in the study reach at 5.5 million m3 for the 50-yr planning horizon.
This value can be compared with the 7.6 million m3 which is currently permitted for mining in
El Barbon Wash.
The stratigraphy of wells in El Barbon Wash shows alluvial materials. For reference, Fig. 16 shows the stratigraphy of three wells in corresponding parcels of the Ojos Negros valley. 4.5 Regulation of sand mining in Mexico The Government of Mexico, through its various agencies that have jurisdiction on water resources and the environment, is currently developing an emergency norm (Norma Oficial Mexicana de Emergencia) to regulate the extraction of sand and rock from streambeds of rivers and washes. The norm stipulates the conditions that govern sand-mining operations in the entire country, with specific reference to the emergent situation in the state of Baja California (Fig. 17). In the past few years, sand mining for import to the United States has increased steadily, and the need has arisen to enact regulation to safeguard natural resources which could possibly be impacted by the mining operations. Specific provisions of the (tentative) norm are the following:
The natural streambed is that occupied by the maximum ordinary flood, assumed to be equivalent to the 5-yr flood for perennial streams and the 10-yr flood for ephemeral streams or washes. The federal stream zone consists of the natural streambed and the portion immediately adjacent to it, on both sides. For streambed widths greater than 5 m, the width of the federal zone, outside of the natural streambed, is 10 m on each side, measured horizontally; for streambed widths 5 m or less, the width of the federal zone is 5 m on each side, measured horizontally. After mining is complete, the edge of the pit should be graded to a 2.5:1 slope in the direction of the flow. During mining, the operator is required to maintain an undisturbed layer of 8-m minimum thickness for the protection of the aquifer. During mining, the operator is required to maintain an undisturbed unsaturated zone of 4-m minimum thickness. No paved roads are permitted within the natural streambed, and there is an upper limit to the size and weight of vehicles that are permitted on the streambed. |

|
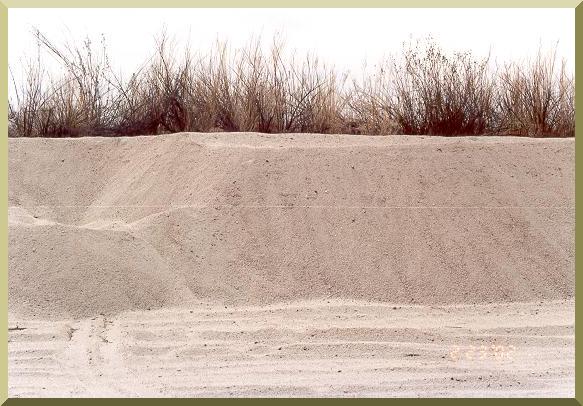
| Fig. 17 Sand mining in El Barbon Wash near Real del Castillo, Baja California (February 2002). |
| Noise pollution is regulated by the Municipality of Ensenada, which has jurisdiction over the Ojos Negros valley. The applicable legislation is the "Reglamento para el control de la calidad ambiental del municipio de Ensenada" (Law for the control of environmental quality in the municipality of Ensenada). Noise is defined as every sound that causes annoyance, interferes with sleep, work or rest, or that produces physical or psychological harm to the individual, flora, fauna, and public or private goods. The law specifies the permissible levels of noise pollution shown in Table 4. Sandmining operations are required to comply with this local regulation. |
| Table 4. Permissible noise levels in the Municipality of Ensenada. | |
| Source | Noise Level, Db(A) |
| Fixed | 68 (from 06:00 to 22:00) 65 (from 22:00 to 06:00) |
| Loading and unloading of goods and materials | 90
(from 07:00 to 22:00) 85 (from 22 to 07:00) |
| Automotive vehicles (Weight < 3 ton) (Weight 3-10 ton) (Weight > 10 ton) | 79 81 84 |
| Impacts of Sand Mining | Management | Regulation of Sand Mining in the U.S. | Summary | Sand Mining Facts |
| http://ponce.sdsu.edu/protected2/sandminingfacts04.html | 020805 |

